
Research Guides
HPLC Peak Integration Explained: Baselines, Peak Areas and Manual Changes
Sep
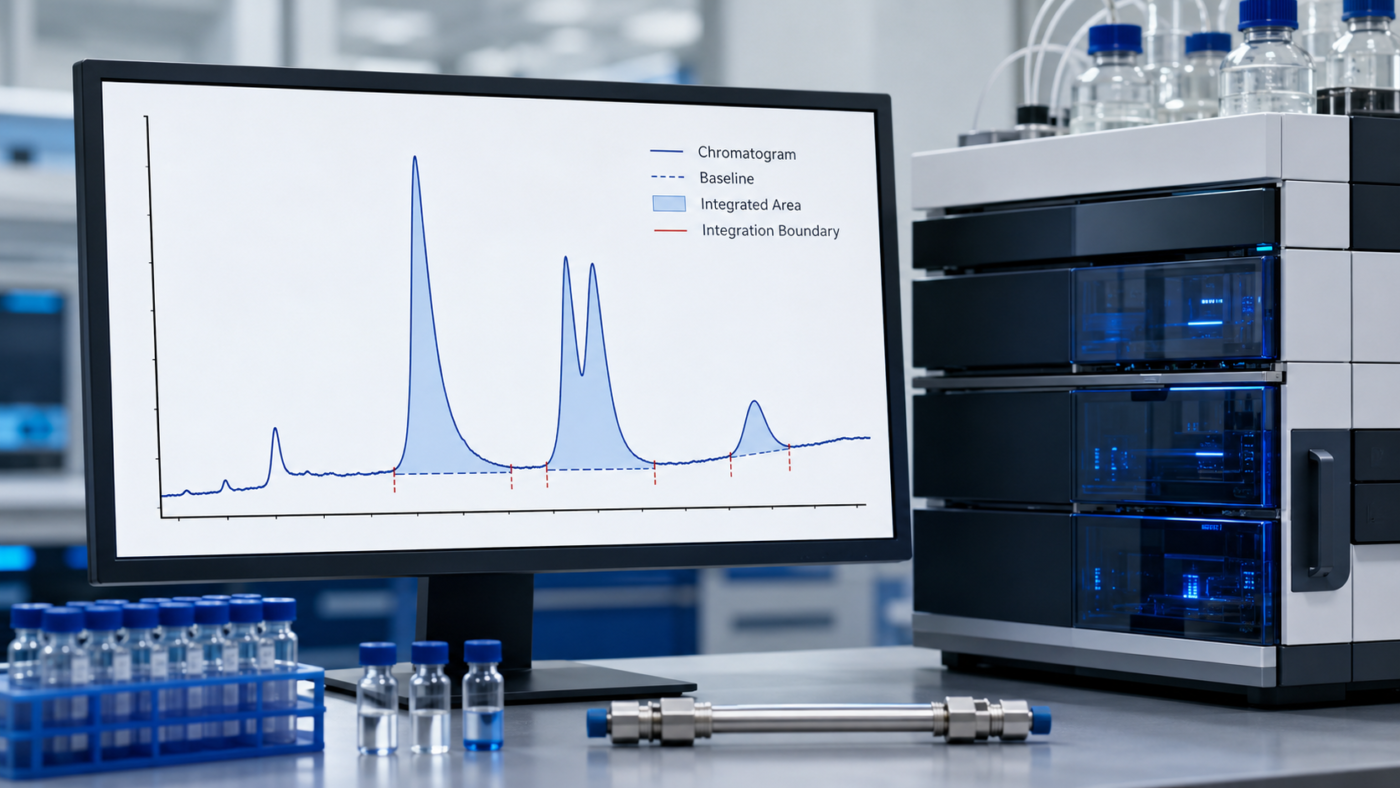
HPLC peak integration converts a chromatographic detector signal into a numerical area or height that can be used for purity calculations, calibration and quantitative analysis. The software must decide where each peak begins, where it ends and which baseline lies beneath it.
Small changes to these decisions can alter a reported result, particularly for low-level impurities, overlapping peaks, broad signals or chromatograms with baseline drift. For this reason, integration should be controlled by a defined analytical procedure and supported by reviewable chromatograms and audit records.
This guide is intended exclusively for controlled laboratory and analytical research. It does not replace validated procedures, laboratory protocols, applicable standards or professional analytical review. The materials discussed are not intended for human consumption, diagnostic use, therapeutic use or clinical application.
What Is HPLC Peak Integration?
High-performance liquid chromatography separates sample components and records detector response over time. The resulting chromatogram displays retention time on the horizontal axis and detector response on the vertical axis.
Peak integration measures the response assigned to a chromatographic component. The software normally identifies:
- The beginning of the peak
- The end of the peak
- The baseline underneath the peak
- The peak apex
- The integrated area
- The peak height
- The retention time
The calculated value can then be used in an area-normalization result, calibration curve, impurity calculation or quantitative assay.
Peak Area vs Peak Height
| Measurement | What it represents | Important consideration |
|---|---|---|
| Peak area | Integrated detector response between the peak boundaries and baseline | Affected by peak width, boundaries and baseline placement |
| Peak height | Distance from the baseline to the peak apex | Affected strongly by peak shape, noise and broadening |
| Area percentage | One integrated area relative to the total included area | Depends on which peaks were detected and included |
| Response ratio | Analyte response compared with an internal-standard response | Requires consistent integration of both peaks |
Peak area is commonly used because it captures response across the complete chromatographic peak. Peak height may be appropriate for some methods when adequately justified.
How Is a Chromatographic Peak Area Calculated?
Chromatography software divides the detector signal into small time intervals and estimates the response above the selected baseline. These contributions are combined to calculate the integrated area.
The resulting value depends on:
- The recorded detector signal
- Data-acquisition frequency
- Peak-start and peak-end positions
- Baseline construction
- Noise filtering or smoothing
- Peak-detection thresholds
- Rules for shoulders and overlapping peaks
The numerical area is therefore not independent of the method and software settings used to generate it.
What Is the Chromatographic Baseline?
The baseline represents the detector response that would be present without the integrated chromatographic peak. Integration measures the peak signal relative to this estimated line.
A baseline may be approximately flat, sloped, curved or affected by disturbances. The software may connect the beginning and end of a peak using a straight line or apply another defined baseline method.
If the baseline is placed too high, part of the peak response may be excluded. If it is placed too low, background response may be included as part of the peak.
Why Baseline Selection Matters
Baseline placement can materially influence results when:
- The peak is small relative to background noise.
- The chromatogram has significant drift.
- Two peaks overlap.
- The principal peak has a long tail.
- A broad unresolved signal is present.
- The chromatogram contains a solvent disturbance.
The effect may be minor for a large, narrow and isolated peak but substantial for a low-level impurity or partially resolved component.
What Causes Baseline Drift?
Baseline drift is a gradual increase or decrease in detector response during a chromatographic run. Possible causes include:
- Changes in mobile-phase composition during a gradient
- Differences in solvent ultraviolet absorption
- Temperature changes
- Column equilibration
- Detector-lamp instability
- Mobile-phase contamination
- Column bleed
- Air bubbles or flow instability
Some gradient-related baseline change may be expected and reproducible. Unexpected or irregular drift should be investigated before relying on low-level integrations.
Peak Detection Thresholds
Integration software uses defined thresholds to distinguish peaks from background noise. These may include minimum area, minimum height, minimum width, slope sensitivity or signal-to-noise requirements.
If the threshold is set too high, small but relevant peaks may be excluded. If it is set too low, noise fluctuations may be integrated as apparent impurities.
The threshold should match the procedure’s reporting requirements and demonstrated analytical capability.
Peak Start and Peak End
The beginning and end of a peak determine the interval included in the area calculation. Incorrect boundaries can:
- Exclude part of a broad or tailing peak
- Include neighboring noise
- Combine adjacent components
- Divide one peak into multiple areas
- Change impurity or assay calculations
Integration boundaries should be applied consistently to standards, suitability preparations, controls and samples unless a documented scientific reason supports different treatment.
How Overlapping Peaks Are Integrated
Partially resolved peaks require the software to assign their overlapping response. Common approaches may include:
- Dropping a perpendicular line from the valley
- Using a skim or tangent baseline
- Exponential skimming
- Curve-fitting or deconvolution
- Treating the signals as one unresolved peak
Different approaches can produce different individual peak areas even though the underlying detector signal is unchanged.
When the method does not adequately separate the components, changing integration rules cannot recreate information that the chromatographic separation failed to provide. Read HPLC Peak Resolution Explained for more information about overlapping peaks and co-elution.
What Is Valley-to-Valley Integration?
Valley-to-valley integration places a baseline between the lowest points separating adjacent peaks. It may be used when peaks are reasonably distinct but do not return completely to the original baseline.
The approach can be inappropriate when one component appears as a small shoulder on a much larger peak. The selected method should reflect the actual chromatographic relationship and intended calculation.
What Is Tangent-Skim Integration?
Tangent-skimming attempts to estimate the contribution of a smaller peak positioned on the tail of a larger one. A line or curve is used to separate the smaller response from the larger peak’s declining signal.
The calculated result can be sensitive to the skim start, skim end and software model. A method relying on this technique should define its parameters and demonstrate suitable performance.
What Is Peak Splitting?
Peak splitting occurs when one chromatographic feature is divided into two or more integrated peaks. It may reflect actual components, but it can also result from:
- Noise near the peak apex
- An unsuitable peak-width setting
- Excessive integration sensitivity
- Column or injection problems
- Sample-solvent incompatibility
- A genuinely unresolved mixture
Automatically combining every split peak can conceal an impurity. Treating every split as a separate compound can also misrepresent the sample. The chromatographic evidence must be reviewed.
Automatic vs Manual Peak Integration
Automatic integration
Automatic integration applies predefined software parameters consistently across chromatograms. It generally provides better reproducibility and reduces subjective decision-making.
Manual integration
Manual integration occurs when an analyst changes a peak boundary, baseline or peak assignment after the automatic calculation.
Manual integration may sometimes be scientifically necessary, but it should not be used simply to obtain a preferred result or make a sample meet a specification.
When May Manual Integration Be Justified?
Examples that may require review include:
- The software incorrectly integrates a solvent disturbance.
- A known peak is missed because of an unusual but explainable baseline.
- A clearly unrelated artifact is assigned as a sample component.
- An established integration event fails because of a documented anomaly.
Any change should follow the laboratory’s approved procedure and preserve the original data.
What Should Be Documented for Manual Integration?
A defensible manual-integration record should identify:
- The original automatic result
- The modified result
- The chromatogram affected
- The parameter or boundary changed
- The scientific reason for the change
- The analyst who made the change
- The date and time
- The reviewer and approval
- Any effect on the reported result
The original electronic data and audit trail should remain available for independent review.
Why Reprocessing Must Be Controlled
Reprocessing means applying new processing or integration settings to previously acquired chromatographic data. Reprocessing can be legitimate during method development, investigation or authorized data review.
It becomes concerning when multiple integration approaches are tried without documentation and only the preferred result is retained.
Controlled reprocessing should use approved methods, defined permissions, audit trails and documented reasons.
Peak Integration and HPLC Purity Percentage
In area normalization, the principal peak area is divided by the total included peak area. The result is therefore directly affected by integration.
The reported percentage may change when:
- A small peak is included or excluded.
- The principal-peak boundaries change.
- An adjacent impurity is skimmed differently.
- A solvent or blank peak is included.
- The reporting threshold changes.
- A co-eluting impurity remains within the principal peak.
An isolated percentage provides less evidence than a complete chromatogram, integration table and processing method. See HPLC Purity Percentage Explained.
Peak Integration in Quantitative Calibration
Calibration standards and samples should be processed consistently. If the calibration peaks use one integration approach and the samples use another, the quantitative relationship may be distorted.
Integration problems can affect:
- Calibration slope and intercept
- Residual patterns
- Back-calculated standard concentrations
- Quality-control results
- Unknown sample concentrations
Review the complete quantitative workflow in HPLC Calibration Curves Explained.
Integration and System Suitability
System-suitability calculations such as repeatability, tailing, theoretical plates and resolution depend on correctly detected and integrated peaks.
An unstable baseline or incorrect peak assignment can produce misleading system-suitability calculations. Passing values should be reviewed together with the chromatograms used to generate them.
See HPLC System Suitability Testing for the full performance-review process.
Blank, Solvent and System Peaks
Not every peak in a chromatogram originates from the target sample. Signals may arise from:
- Sample solvent
- Mobile phase
- Vial or closure extractables
- Carryover
- Column contamination
- Reagents used in sample preparation
- Instrument or system disturbances
Blank injections help identify signals unrelated to the sample. Peaks should not be excluded merely because they are inconvenient; their origin and relevance should be scientifically evaluated.
How to Review an Integration Table
A useful integration table may include:
- Peak number
- Retention time
- Peak area
- Peak height
- Area percentage
- Peak width
- Peak identification
- Integration type or event
Compare the table with the visible chromatogram. Every relevant listed peak should be visible, and every meaningful visible peak should be accounted for.
HPLC Integration Warning Signs
- A purity percentage without an integration table
- Cropped chromatograms hiding the baseline
- Visible peaks missing from the table
- Different integration settings applied without explanation
- Manual changes with no audit record
- Peak boundaries cutting through visible response
- Noise integrated as multiple impurities
- A shoulder combined with the principal peak
- Failed injections removed without justification
- Only the final reprocessed chromatogram retained
- Blank peaks excluded without documented evaluation
Practical Peak-Integration Review Checklist
- Review the complete chromatogram at a readable scale.
- Confirm the correct processing method was used.
- Compare peak boundaries with the visible signals.
- Examine the baseline beneath important peaks.
- Look for drift, noise, shoulders and overlapping peaks.
- Compare the chromatogram with the integration table.
- Review blank and standard injections.
- Identify manual integrations or reprocessing.
- Check the reason, audit trail and approval for every change.
- Determine whether the change affected the reported result.
For a broader documentation workflow, read How to Read a Research Compound COA and What to Look for in a Third-Party Laboratory Report.
Frequently Asked Questions
What does HPLC peak integration measure?
It measures detector response assigned to a chromatographic peak between defined boundaries and relative to a selected baseline.
Can changing the baseline change an HPLC result?
Yes. Baseline placement affects the response included in the calculated peak area, especially for small, broad, tailing or overlapping peaks.
Is manual peak integration always unacceptable?
No. It may sometimes be scientifically justified, but the original result, reason, change, user, time and approval should be documented.
Why might a visible peak be missing from an integration table?
It may fall below a configured threshold, be excluded by an integration event or be treated as noise or a system-related signal. The reason should be reviewable.
Does automatic integration guarantee an accurate result?
No. Automatic processing improves consistency, but unsuitable settings can still miss relevant peaks, integrate noise or assign incorrect boundaries.
Can integration fix co-eluting peaks?
Integration may estimate contributions from partially overlapping signals, but it cannot reliably recover information that the chromatographic separation never produced.
Why should original chromatographic data be retained?
Original data allow reviewers to compare acquisition results with later processing, integration changes and final reported values.
Peak integration should be reviewed alongside the original chromatogram, method settings and batch documentation. Researchers can compare materials in the Kimerachems analytical reagents category and review available analytical reports through the certificate of analysis library.
Conclusion
HPLC peak integration transforms a detector trace into numerical results used for purity, calibration and quantitative analysis. Peak boundaries, baseline selection, detection thresholds and rules for overlapping signals can all influence the reported values.
Reliable integration requires a predefined processing method, consistent application, retained original data and documented review of manual changes. A reported percentage or peak area should be evaluated alongside its chromatogram, integration table and audit trail.
Technical References
- ICH Q2(R2): Validation of Analytical Procedures
- ICH Q14: Analytical Procedure Development
- FDA: Data Integrity and Compliance With Drug CGMP
