
Tag Archives: Laboratory Documentation

HPLC Peak Integration Explained: Baselines, Peak Areas and Manual Changes

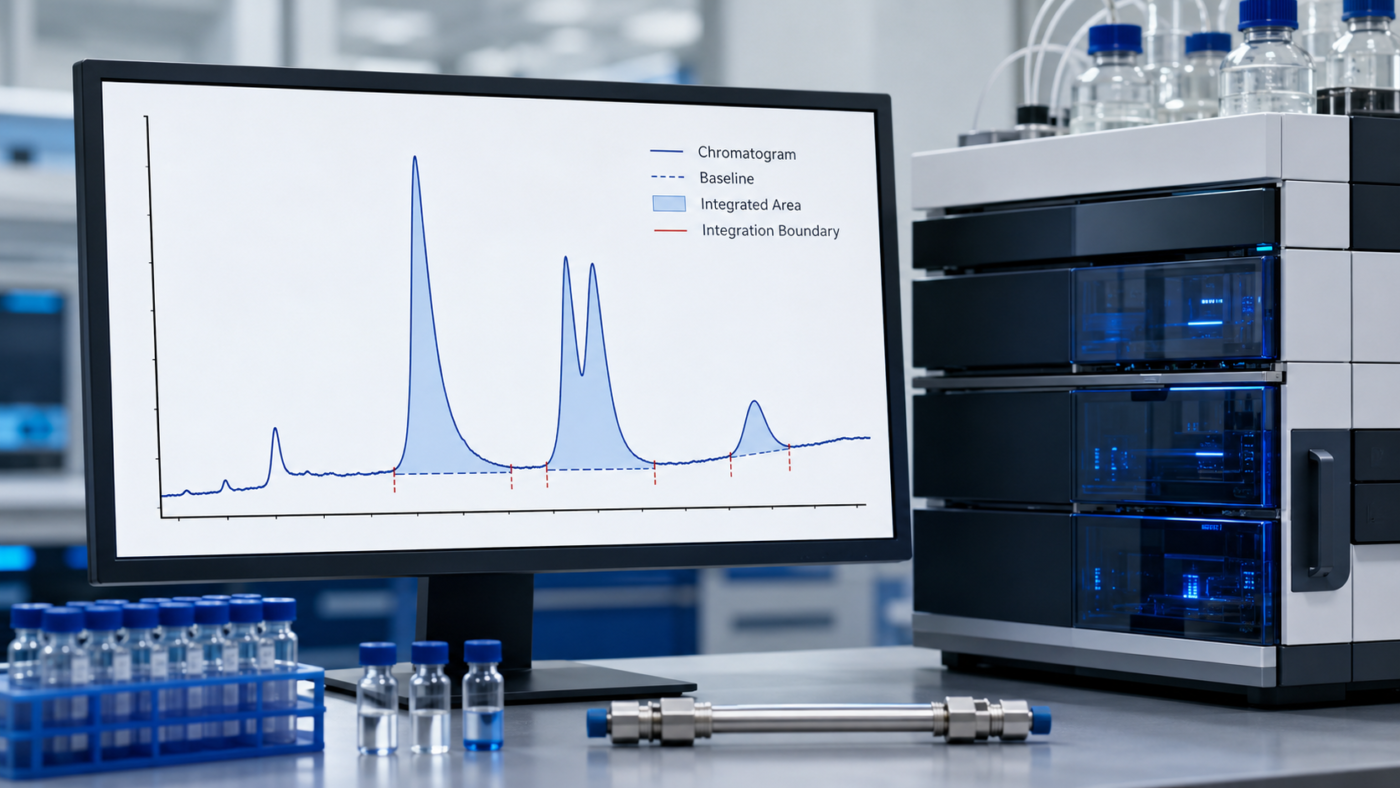
HPLC peak integration showing baseline selection and integrated peak areas

HPLC peak integration calculates chromatographic response between defined boundaries and a selected baseline. Learn how integration settings, baseline drift, overlapping peaks and manual changes can influence reported purity and assay results.

How to Read a Research Compound COA: HPLC, MS & NMR

How to read a research compound COA with HPLC, MS and NMR data

Learning how to read a research compound COA is essential when reviewing the identity, purity and batch documentation of a laboratory material. A Certificate of Analysis should connect a specific batch to clearly reported analytical results rather than simply display a purity percentage. HPLC, mass spectrometry and NMR provide different kinds of information. No single […]