
04
Sep
Sep
HPLC LOD and LOQ describe different method-performance limits. Learn how detection and quantitation limits are estimated, why signal-to-noise ratios are not universal rules and what documentation should support reported values.

HPLC LOD and LOQ describe different method-performance limits. Learn how detection and quantitation limits are estimated, why signal-to-noise ratios are not universal rules and what documentation should support reported values.

Compare the principal HPLC detector types, including UV, PDA, fluorescence, refractive index and charged aerosol detection. Learn how analyte properties, mobile phases, sensitivity and analytical objectives determine which detector is appropriate.

HPLC detection wavelength determines which UV-absorbing compounds produce measurable signals and how strongly they respond. Learn why chromatograms, impurity profiles and reported area percentages can change when a different wavelength is selected.
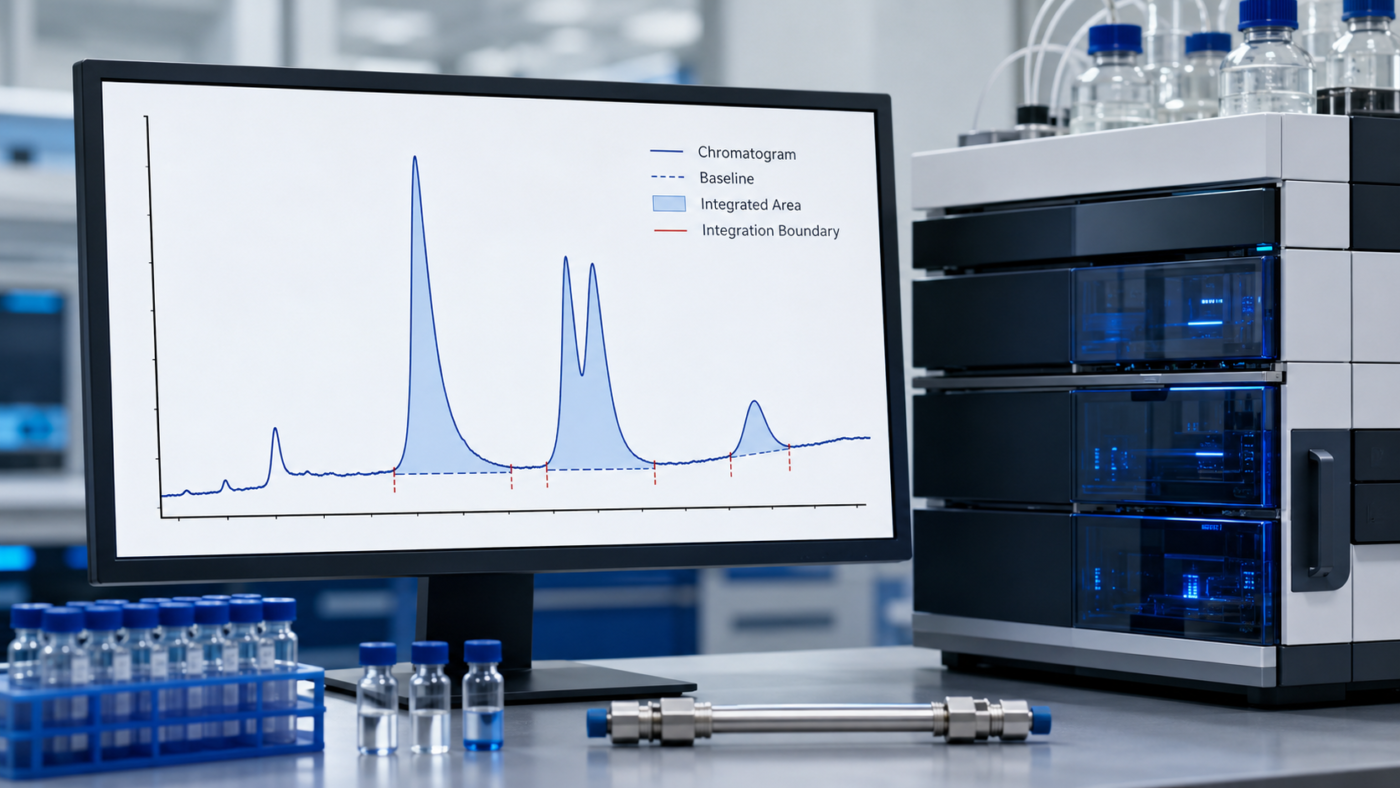
HPLC peak integration calculates chromatographic response between defined boundaries and a selected baseline. Learn how integration settings, baseline drift, overlapping peaks and manual changes can influence reported purity and assay results.

HPLC peak resolution describes how effectively chromatographic components are separated. Learn how overlapping peaks and co-elution can affect identity, purity, integration and quantitative analytical results.
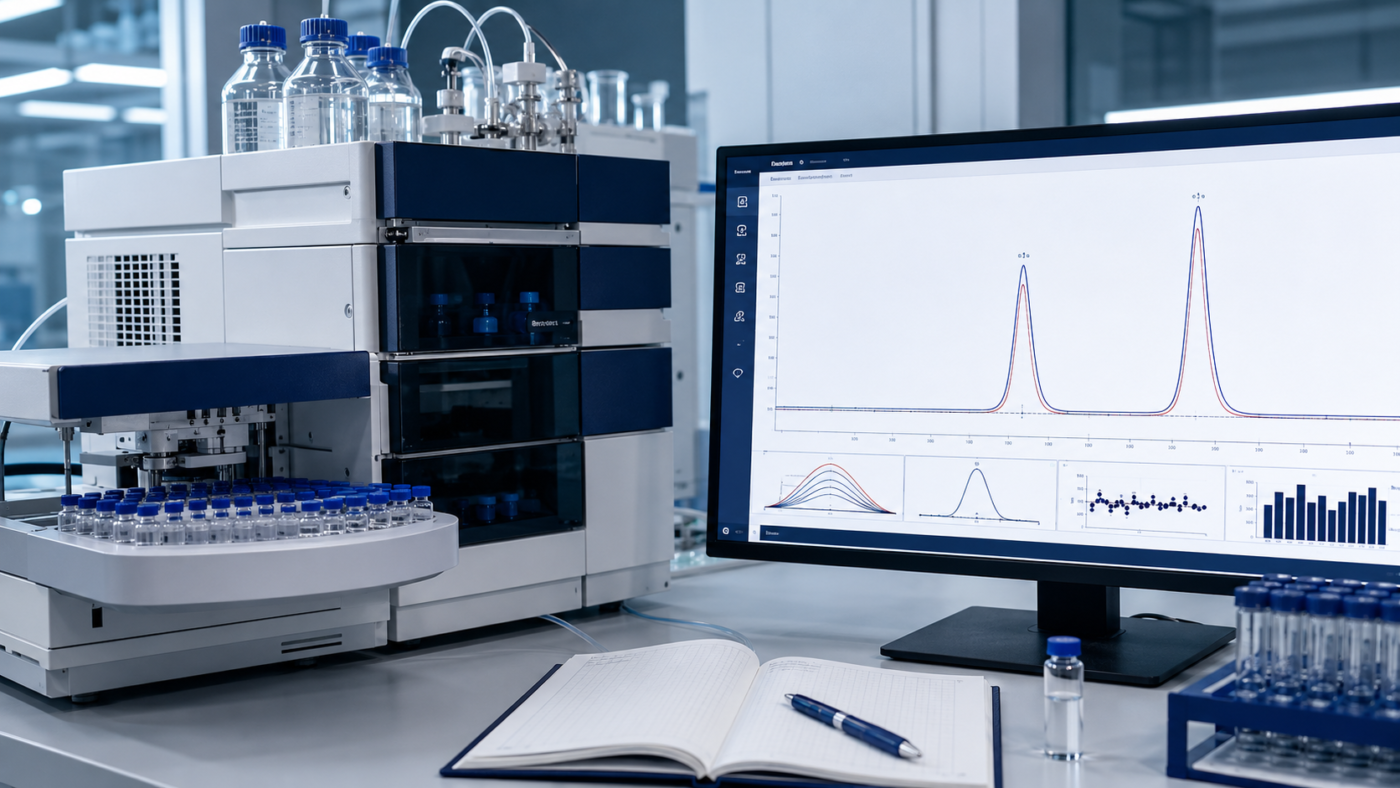
HPLC system suitability testing checks whether an instrument, column and analytical procedure are performing adequately before or during sample analysis. Learn how resolution, repeatability, tailing, retention and efficiency criteria are evaluated.

An HPLC calibration curve relates detector response to known analyte concentrations. Learn how laboratories prepare calibration standards, select a mathematical model and evaluate linearity, range, residuals and unknown samples.

An HPLC purity percentage describes the relative detector response assigned to a compound under a specific chromatographic method. Learn what this number can demonstrate, what can influence it, and which complementary tests are needed for stronger analytical confidence.

Learning how to read a research compound COA is essential when reviewing the identity, purity and batch documentation of a laboratory material. A Certificate of Analysis should connect a specific batch to clearly reported analytical results rather than simply display a purity percentage. HPLC, mass spectrometry and NMR provide different kinds of information. No single […]